
Using parameters to build advanced Insights
Our Insights platform lets you build your own reports right within SyncHub itself. It is a great solution if you’re not using your own external reporting tool like Power BI or G-Sheets, or if you need a quick ad-hoc dashboard to share with your team.
But its simplicity belies its power. In this section I’m going to walk you through one of the most powerful features of Insights - parameters.
Note: make sure you read to the bottom of this article and familiarize yourself with the coolest features - report filtering and caching
The problem
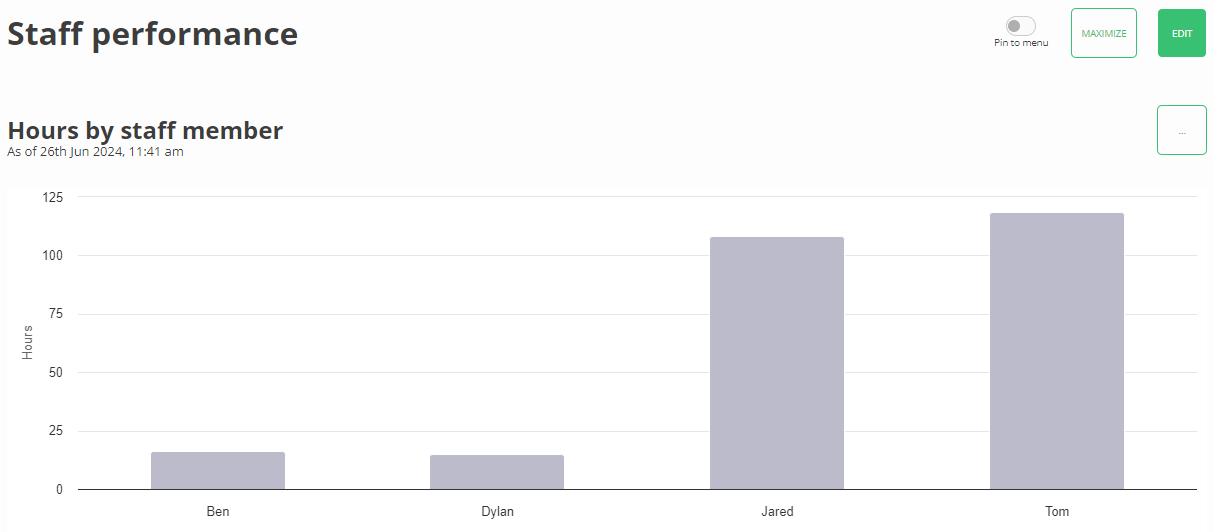
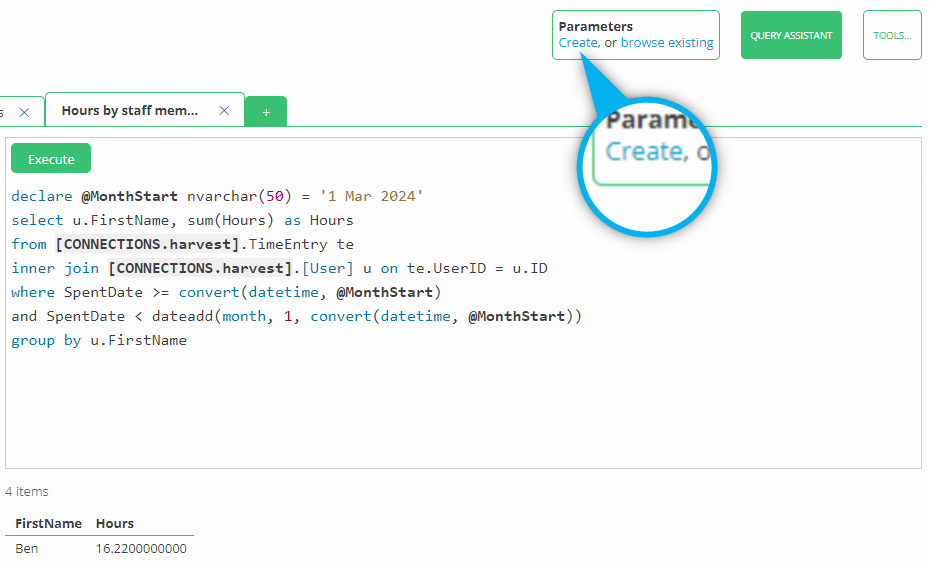
Let’s say I’m an analyst working for a professional services company. They’ve asked that I build them a report showing the amount of time their staff worked in the prior month, March. No problem - I whip out the SyncHub Query Editor and quickly come up with the following:

The boss is “kind of a visual guy” so I’ve bound this to an Insight too:
Job done, right? Of course, not - there’s always something else and sure enough the next month they want the same report for April. I can see the writing on the wall here, and there’s no way I want to be manually updating that query every month to get the new data.
This is where SyncHub’s Insight Parameters come in. Let’s see how they work.
Introducing…Insight Parameters
Just like regular programming, parameters allow us to remove any hard-coding of values out of our reports, and instead pass them in to the report at run-time. In this case, what I’d like to do with my report, is change the report date to a parameter, so that I don’t have to log in and change it every week.
So, I jump back to the query and create a new parameter from the main menu:
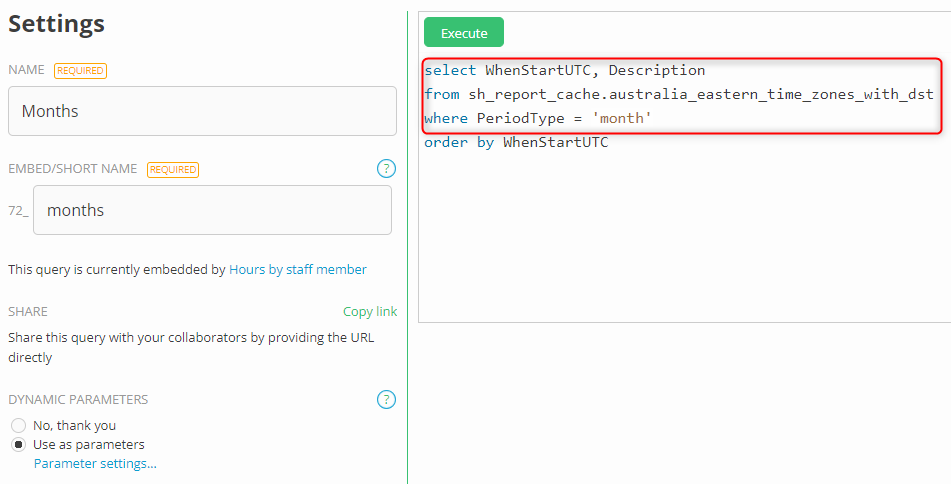
Parameters behave precisely the same as other SQL queries - in fact, they are queries, but with a couple of extra little details. So, I go in and write up a list of months, then indicate how exactly I’d like to parameterize them:
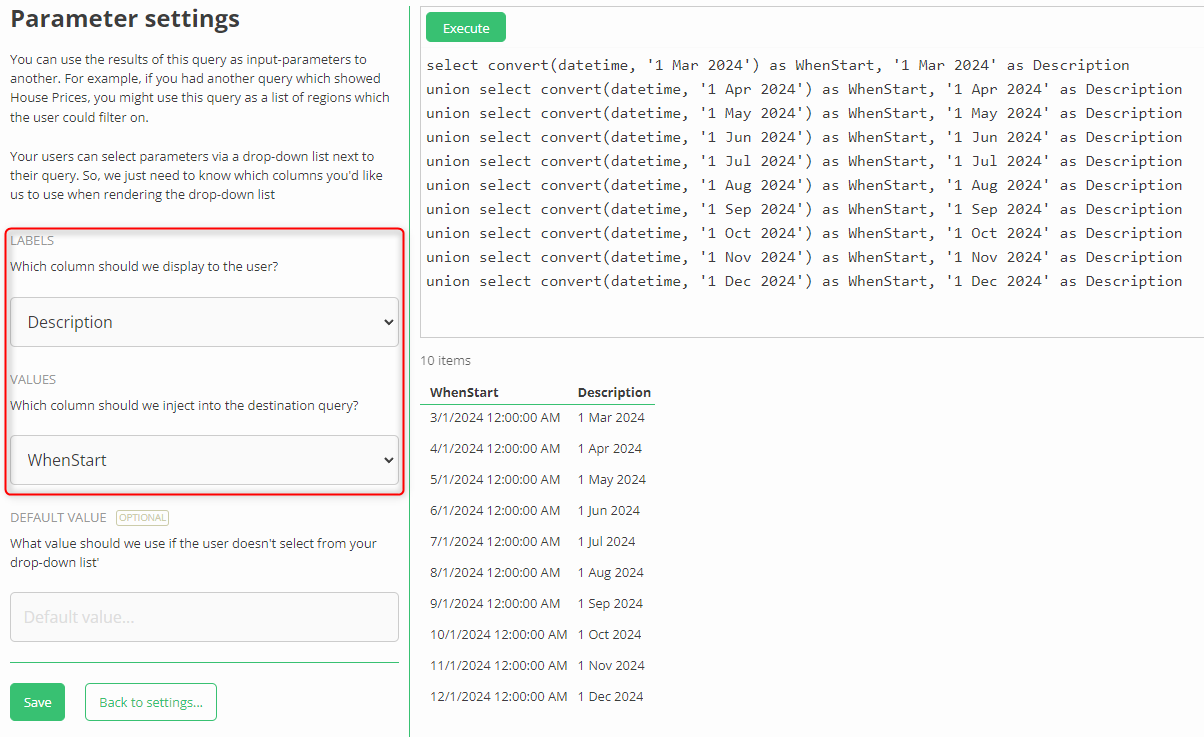
Note how the query executes as usual, and provides a couple of columns - WhenStart and Description. In order to make this parameter useful for humans to use, I need to tell SyncHub two things:
Which column should be injected into our queries
Which column should be displayed to the user when they are selecting a query
I have highlighted this section in red in the screenshot above. I also want to give this query a name so that I can embed it later. In this case, I have given it the name months:

Now, I return back to my original query and inject it using the special [PARAMETERS] syntax, replacing my previously hard-coded month variable:
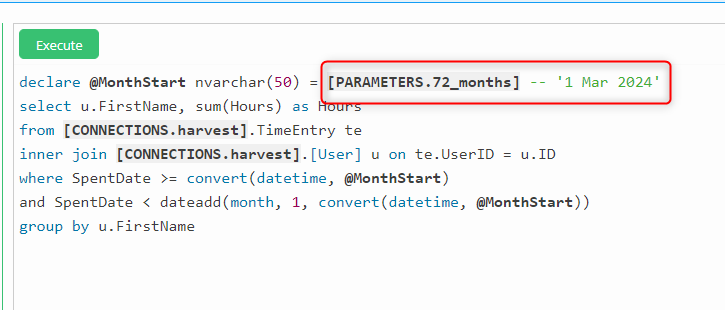
And voila! A new drop down list appears at the top of my query, allowing me to easily switch back and forth between months with ease:
That’s the foundation of parameters, and I’m sure you can see how powerful they are. You can even embed parameters within parameters!
But the key word here is foundation because parameters also underpin a lot of other bonus features within Insights. Let’s quickly go through them now.
Bonus 1/2 - Automating the dates
I’m sure you noticed that I manually crafted those dates using a bunch of UNION statements. This works, but it’s pretty ugly. Also, it doesn’t consider daylight savings or the timezone the user is in. SyncHub has solved this problem for us with a handful of installable Insights that we can use, which do these calculations for us and keep the dates up-to-date over the years so I don’t have to keep augmenting that UNION statement.
So, I return to SyncHub and simply install it from the store…

…then use this to populate the Months parameter, like so:
The parameter list will now dynamically update over the months, without me ever having to return to manage the report. Cool, right?
Bonus 2/2 - Partitions, caching & report filtering
The observant may have noticed when I built my first Insight that it was composed of just a single partition:
But now that you have your parameter, this partition count has grown too:

This is because parameters let SyncHub break up Insights into smaller digestible partitions and store each one separately. This in turn provides two super-cool benefits - Report Filtering & Report Caching…
Report filtering
Yip - these parameters are now available on the Insights dashboards, so my boss can flick between them within a single chart.
Or, if the boss wants to see all the months side-by-side, Insights can do that too - just adjust the multi-series value in your Insights settings:
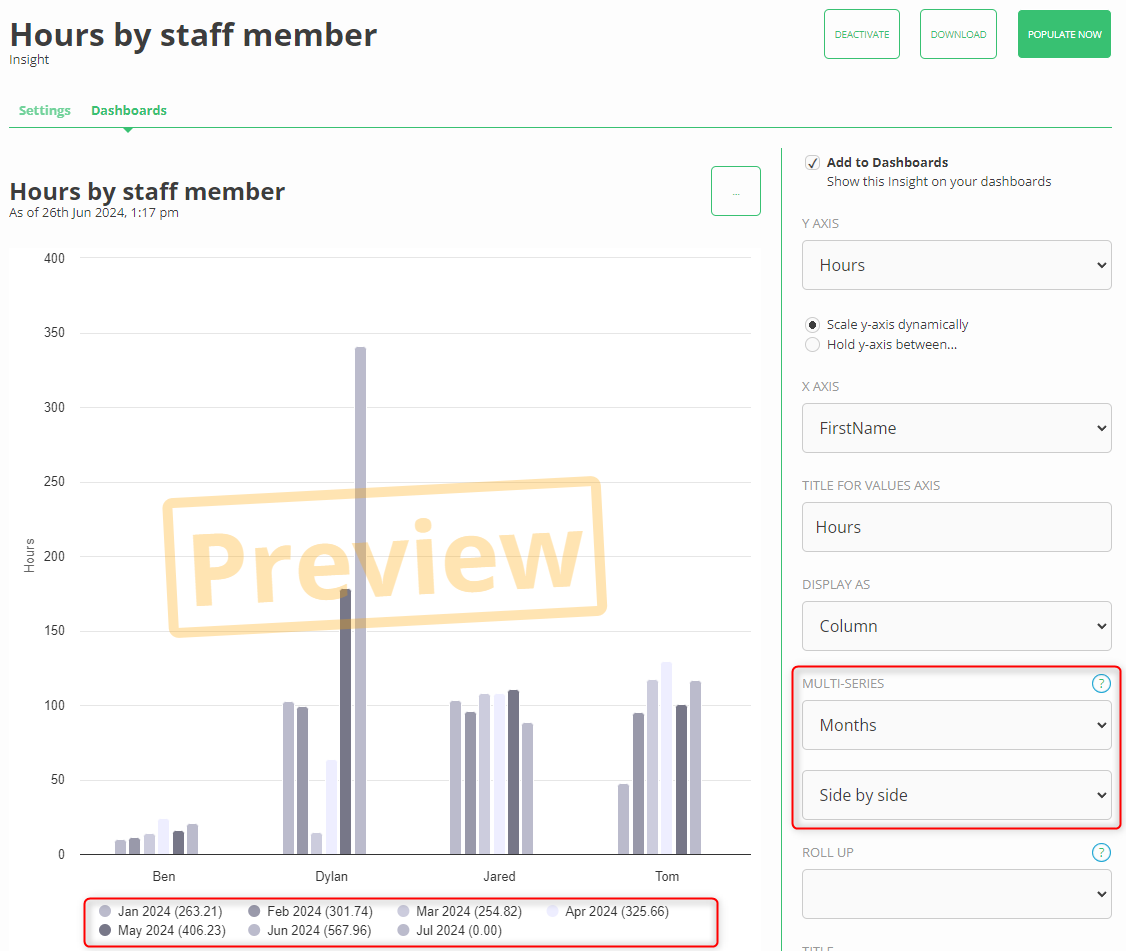
I sense a pay rise coming my way…
Report caching
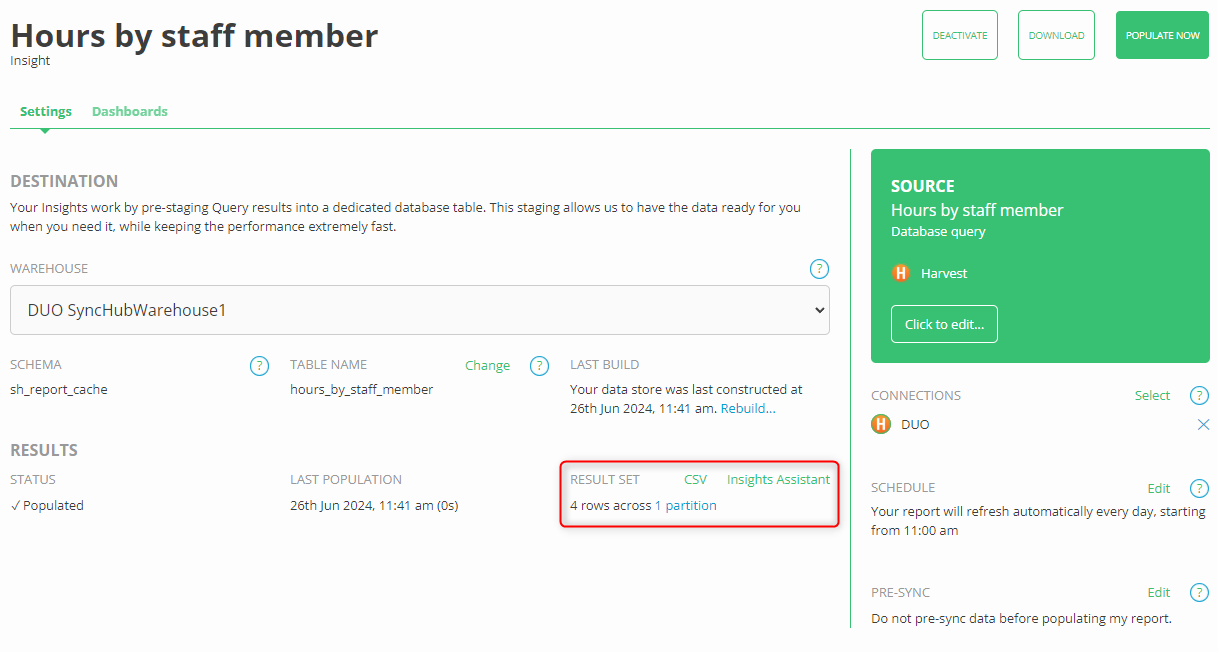
We finally get to the most powerful benefit of parameters, which is our ability to massively improve the performance of our Insights using report caching. Click the partition link I mentioned earlier and we can drill down into exactly how our Insight is calculated.

Note in particular the caching information I have highlighted in red. A locked partition will not calculate again, which means your Insight data is locked in and doesn’t have to be recalculated. This isn’t practical for some Insights, but in our example above (historical time) this is perfect as timesheet entries are unlikely to change after, say, a month. In this case, I put in a cache period of 32 days which means that if our Insight detects no changes within this period, SyncHub don’t bother calculating it again, meaning it can focus its energies on recent months. You can see it’s already been applied to January, February and March.
To conclude
Parameters supercharge your Insights by making them both more efficient and easier to maintain.
Have fun!